Ladder Capital (LADR)·Q4 2025 Earnings Summary
Ladder Capital Beats EPS on Record Loan Originations, Revenue Misses
February 5, 2026 · by Fintool AI Agent
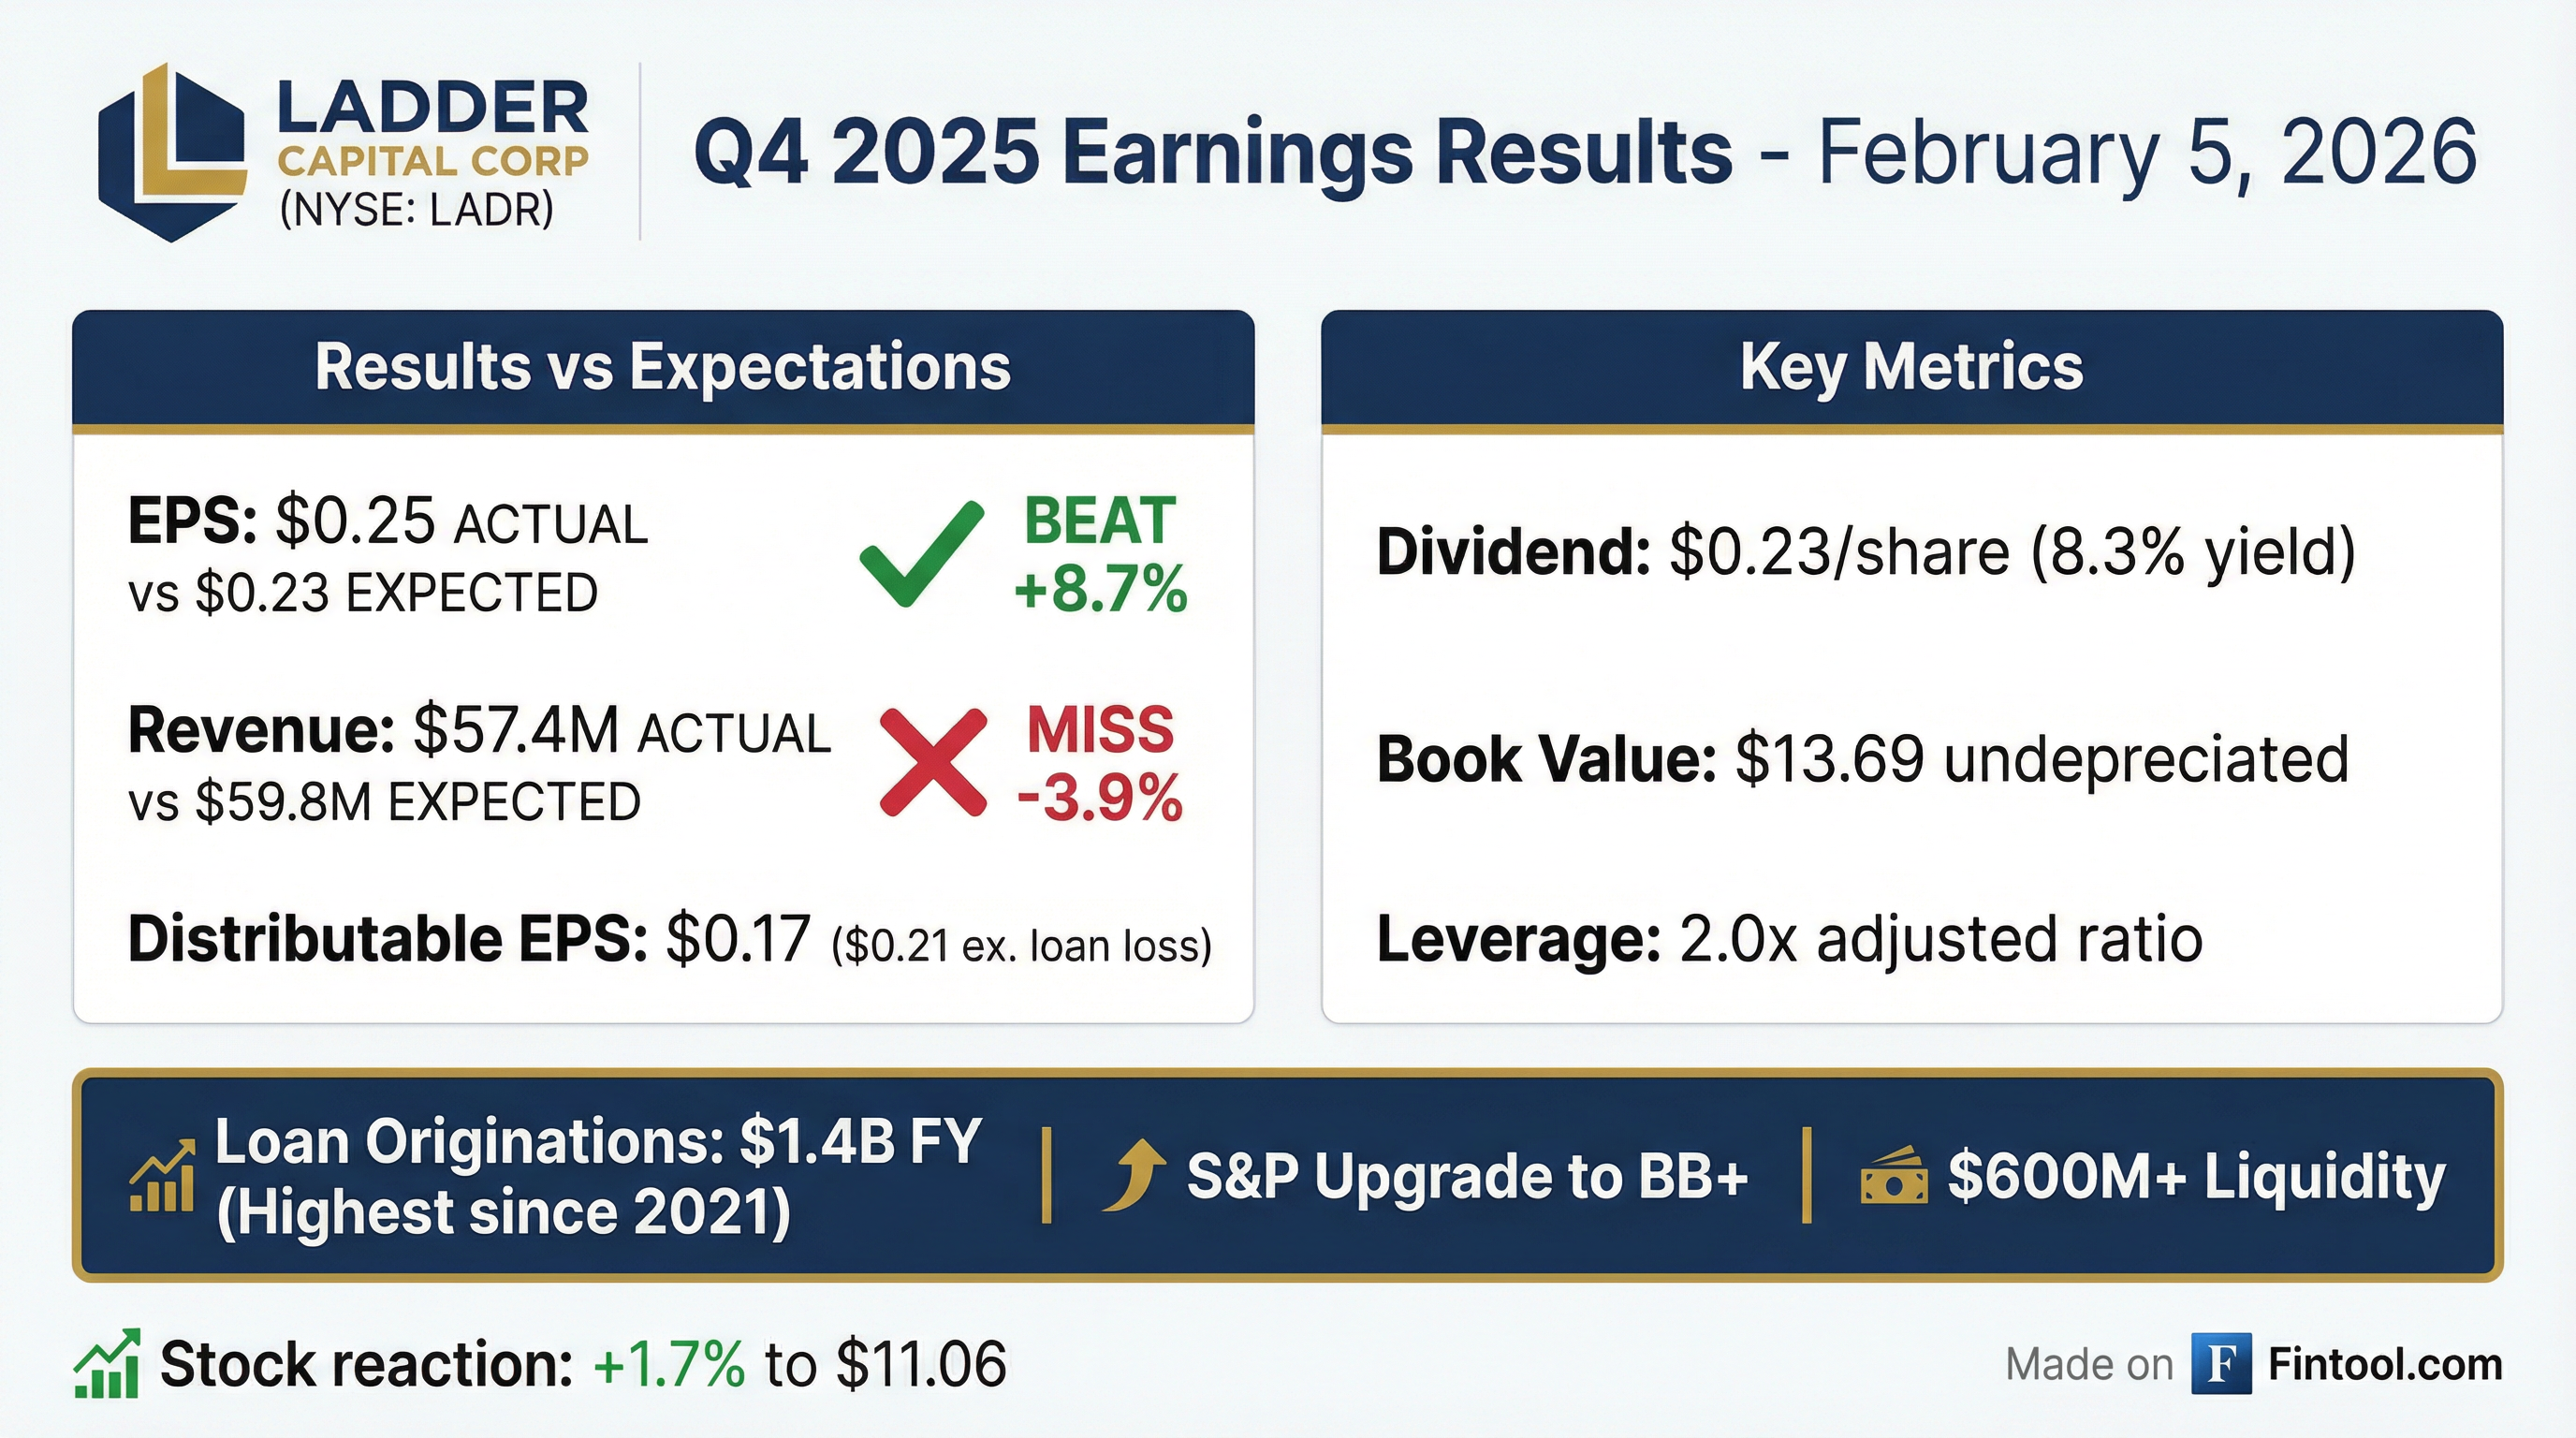
Ladder Capital (NYSE: LADR) reported Q4 2025 results that beat EPS expectations despite a revenue miss, driven by record loan origination activity. The commercial real estate finance platform delivered EPS of $0.25 versus the $0.23 consensus estimate (+8.7%), while revenue of $57.4M came in below the $59.8M expectation (-3.9%).
The stock closed up 1.7% at $11.06 on the day of the announcement, with aftermarket trading pushing shares to $11.09.
Did Ladder Capital Beat Earnings?
EPS: Beat by 8.7% — $0.25 actual vs $0.23 consensus
Revenue: Missed by 3.9% — $57.4M actual vs $59.8M consensus
Distributable earnings for Q4 2025 totaled $21.4M, with Distributable EPS of $0.17 (or $0.21 excluding a $5M realized loan loss on a foreclosed asset).
For the full year, distributable earnings reached $109.9M with a distributable ROAE of 7.1%.
What Drove the Quarter?
Record Loan Originations
The standout story was loan origination activity. Ladder originated $433M in new balance sheet first mortgage loans in Q4, bringing full-year 2025 originations to $1.4B — the highest annual total since FY 2021.
The company has already closed over $250M in loans through early February 2026, with an additional $400M+ in the active pipeline.
Loan Portfolio Summary
The loan portfolio grew 40% from $1,566M at year-end 2024 to $2,198M at year-end 2025. Weighted average coupon declined from 8.5% to 7.2% as the Fed rate cut cycle took effect.
How Did the Stock React?
LADR shares rose 1.7% on earnings day, closing at $11.06. In aftermarket trading, shares ticked higher to $11.09.
The stock trades at a 19% discount to undepreciated book value ($13.69) and a 5% discount to GAAP book value ($11.66).
What Changed From Last Quarter?
Improving Trends
-
Loan originations accelerated — Q4 originations of $433M built on Q3's strong $511M, signaling sustained deal flow momentum
-
S&P upgrade to BB+ — In January 2026, S&P raised LADR's rating to BB+, joining existing investment grade ratings from Moody's (Baa3) and Fitch (BBB-)
-
Bond spread tightening — The spread on investment grade bonds issued in June 2025 tightened materially from 167 bps at issuance to ~105 bps
Pressure Points
-
Lower portfolio yield — Weighted average loan coupon declined from 7.7% in Q3 to 7.2% in Q4 as new loans were originated at lower rates
-
Realized loan loss — A $5M charge-off on a foreclosed loan impacted distributable EPS by $0.04
-
Book value erosion — Undepreciated book value declined from $13.88 at year-end 2024 to $13.69, reflecting distributions exceeding earnings
Capital Structure and Balance Sheet
Ladder maintains an investment grade capital structure with a conservative leverage profile.
The company's liquidity position remains robust with over $600M total liquidity, including $570M of undrawn capacity on its $850M unsecured corporate revolver.
Investment Portfolio Mix
Ladder operates a diversified CRE investment platform across loans, real estate equity, and securities.
The securities portfolio is 97% AAA-rated and 99% investment grade, providing a stable income stream with minimal credit risk.
Dividend and Shareholder Returns
Ladder declared a Q4 2025 dividend of $0.23 per share, consistent with prior quarters, representing an 8.3% annualized yield based on the $11.06 stock price.
The Q4 payout ratio of 135% was elevated due to the $5M loan loss charge-off; excluding this one-time item, the payout ratio would have been ~110%.
Management and directors continue to own over 11% of the company (>$165M at current prices), maintaining strong alignment with shareholders.
EPS Beat/Miss History
Ladder has beaten EPS estimates in 6 of the last 8 quarters.
*Values retrieved from S&P Global
Credit Quality and Watchlist
As of year-end, four loans totaling $129.7M (2.5% of total assets) were on nonaccrual status.
The Portland office loan ($5.8M carrying value, $88/sq ft net of $5M loss reserve) was added to nonaccrual in Q4.
Post quarter-end, Ladder resolved the Harlem multifamily loan through foreclosure. The three-property, 158-unit portfolio is currently 87% occupied and generates "healthy net operating income."
Total CECL reserve remains at $47M ($0.37 per share). Management believes this level is "sufficient to cover any potential losses."
Key Risks and Concerns
-
Interest rate sensitivity — Lower rates compress net interest margins on new originations (coupon down from 8.5% to 7.2% YoY)
-
Office exposure — Office loans declined from 14% to 11% of total assets by year-end
-
Dividend sustainability — Payout ratio exceeded 100% in Q4 due to loan loss; sustained high originations needed to support the dividend
-
Book value erosion — Undepreciated book value down 1.4% YoY ($13.88 to $13.69) as distributions outpace earnings
-
Geographic concentration — Losses concentrated in challenging markets: Portland, Minneapolis, San Francisco
What Did Management Guide?
Management provided clear forward targets during the Q&A:
Revolver Expansion: Ladder secured $400M of additional commitments to exercise the accordion feature on its $850M unsecured revolver, with closing anticipated later in Q1 2026. This will expand total capacity to $1.25B.
ROE Path: CEO Brian Harris indicated 9-10% ROE is achievable within the current capital structure, noting potential upside from conduit business resurgence and real estate gains.
Q&A Highlights
Underwriting Lessons Learned
Management was candid about lessons from the bridge loan cycle. Harris noted that while Ladder's losses were "de minimis compared to others," they were "unacceptably high" relative to internal standards. Key takeaways:
"If I had to look back on one theme that I wish we had not done, I think you have to be very careful when you're writing a bridge loan and you're refinancing one of your competitor's bridge loans. Because if the competitor knows more about it than you do, and if it was that good of a loan, he'd keep it."
Going forward, Ladder will be more cautious on:
- Large cities with unionized workforces and elevated crime
- Refinancing competitor bridge loans that have been on balance sheet 3+ years
- Flyover cities remain preferred — stable population centers most investors overlook
Competitive Landscape
Banks are returning but not competing directly with Ladder's bridge lending:
"The loans that we do, we historically have had an average loan balance of about $25 million... The orphan in the world right now for getting a loan from a large bank or from a conduit or from a bridge lender is at around $80 million-$100 million. A little too big for conduit, it's too small for a single asset, and it's too big for a regional, but it fits us just fine."
Real Estate Equity Success
The first NYC office building investment has been a standout performer:
"The first office building we invested in went from 55% to over 90% occupancy in under a year and a half. So we'll probably refinance that pretty soon, and that might create some capital too, a capital event."
AI and Data Centers
When asked about market volatility around AI CapEx spend, Harris was dismissive:
"We are not a fan of data centers as far as calling them real estate assets. So we weren't doing that before, so I don't think we're going to do it now... If the market is getting concerned about the spend on AI and data centers, you know, there is probably a place in the world for a safe dividend that is based on bricks and mortar and utility for normal everyday people."
Forward Catalysts
- Q1 2026 originations update — Management noted >$250M already closed with $450M+ under application and in closing
- Revolver expansion closing — $400M accordion exercise expected to close in Q1 2026, bringing capacity to $1.25B
- Rating agency actions — Potential for additional upgrades following S&P's BB+ rating in January 2026
- Fed rate trajectory — Further cuts could support real estate values but compress lending margins
- Conduit business recovery — Harris noted it "feels a little bit like 2008 and 2009" — a tailwind for stabilized cash flow lending
Key Takeaways
- EPS beat (+8.7%) despite revenue miss (-3.9%) demonstrates operating efficiency
- Record originations of $1.4B in FY 2025 position the company for earnings growth
- Investment grade capital structure provides competitive financing advantage
- 8.3% dividend yield supported by diversified income streams, though payout ratio bears watching
- Insider alignment remains high with management owning >11% of shares
Data as of December 31, 2025 unless otherwise noted. Sources: Company filings, S&P Global.
View Company Profile | Read Full Transcript | Prior Earnings